


While stock investors are cheering signs that inflation is peaking, the bond market’s best-known harbinger of recessions is flashing its most ominous warning yet that all is not well with the American economy. History has shown that this is never good for global markets.
It goes by the Wall Street lingo as an inverted yield curve, and in recent days it has moved to its most extreme levels since the 1982 recession thanks to a big drop in long-term bond yields. Historically, when this dynamic has occurred over the past 20 years, it has led to a recession in every case. (For a closer look at the history of yield curves and recessions, see our previous story here.)
Although an inverted US Treasury yield curve is not known as an indicator of how deep or how long a recession will be, or even when a recession will begin, market watchers say the message it is sending now is clear.
‘Historically, when you get an inversion that actually sticks around like this […] it’s a very strong indicator that we’re going to a recession,’ says Duane McAllister, a senior portfolio manager at US-based Baird Advisors.
^T&Cs apply.
Instead, it has left many market watchers saying the real question is not whether there will be a recession, but what exactly it will look like. Will it be shallow or deep? Short or drawn out?
Money managers and economists are trying to get a grip on these issues. Others say the outlook is very much up in the air on the heels of recent economic data that has been telling a somewhat conflicting story. Inflation has begun to fall from 40-year highs, and so the Federal Reserve should finally be able to step off the gas of interest rate increases.
Yet inflation remains extremely hot even as it has eased just slightly. Meanwhile, job growth and consumer spending remain strong. Indeed, the Atlanta Fed’s running estimate of fourth-quarter growth known as GDPNow is showing an absolute solid 4.2 percent. Those indicators signal that the Fed cannot afford to stop raising rates too soon and risk further embedding an increase in inflation in the economy, analysts say.
What is an Treasury yield-curve inversion?
The US Treasury yield curve is basically a chart that shows yields on the spectrum of bonds issued by the US government, from Treasury bills to 30-year bonds. The most common way we talk about the yield curve is to map the yields from US Treasury two-year notes out to yields on US Treasury 10-year bonds.
Longer maturities usually offer higher yields than do shorter-dated bonds, which compensates for the higher risks of holding something for longer periods of time.
In rare situations like what is happening now, the shape of the yield curve can turn in reverse, meaning short-term yields rise above long-term yields. That’s called an inverted yield curve.
The one-two punch of the Federal Reserve raising the federal-funds target rate this year and the expectation that the central bank would keep rates rising pushed short-term U.S. Treasury yields higher than a longer-term rate level in 2018. (The fed-funds rate is the interest rate for overnight loans between banks.) The Fed has been on an aggressive course of raising interest rates in an effort to slow the economy and bring inflation from 40-year highs of more than 8% down to a target of 2%.
The signal being sent by an inverted yield curve is that even if interest rates are high now, economic growth (here the pace of economic activity) and inflation will be lower in the future. In the past, that has typically required a recession to be the case.
How much has the yield curve inverted?
Exactly when the yield on two-year notes rises above the 10-year note varies; since early July, the yields on the two-year note have been above the 10-year, and in the months since the gap has been widening. By late October, the US Treasury two-year note was yielding 4.51%, compared with 0.73% at the end of 2021. At the same time, the yield on the U.S. Treasury 10-year note was 4.10%, compared with 1.52% on Dec. 31.
One reason long-term interest rates have been able to fall is that investors expect the Fed to be able to tamp down inflation, said Jan Nevruzi, US rates strategist at NatWest Markets. “Inflation expectations are still relatively anchored,” he says.
This trend was turbocharged further after the October’s Consumer Price Index and Producer Price Index reports that seem to have confirmed the peak of inflation and the beginning of the down-trend. That triggered a leap in bond prices and a slide in yields but produced very large moves among intermediate-term and longer-term bonds. The 10-year's yield fell to 3.67 percent as of November 16 and the two-year's yield to 4.35 percent.
The speed with which long-term bond yields fell more than short-term bond yields meant that the gap between two-year notes and those maturing in 10 years widened out to -0.68 percentage points. The curve was last inverted in October 1982, when the United States economy was also in the midst of a recession that lasted for about a year.
On an alternative yield-curve measure yields on the US Treasury three-month bills compared with yields on the 10-year notes the yield curve is inverted by 65 basis points, the most inverted that measure has been since shortly before the 2001 U.S. recession.
“The market started to have a little bit,” says Alexandra Wilson-Elizondo, head of multi-asset retail investing at Goldman Sachs Asset Management, who says she believes that markets are now too complacent about the duration of the Fed’s tightening cycle.
How bad would a recession be?
In light of the warning signs, and months of wall-chatter in markets about the prospects of a recession, which is typically defined as two consecutive quarters of contraction in gross domestic product, should one befall, there is little reason for investors to be caught off guard.
“This will be the most well-anticipated recession in history,” says John Linehan, portfolio manager of the US large-cap equity income strategy and chief investment officer at T. Rowe Price.
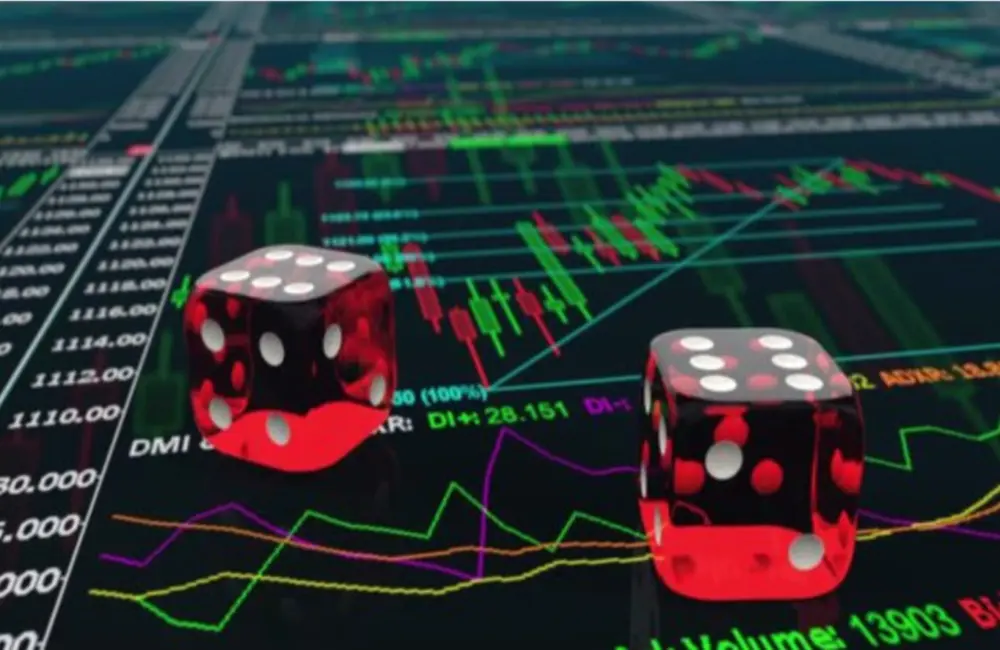
It’s still a coin flip in terms of whether the economy will end up in an official recession, notes Preston Caldwell, chief US economist, and this might not be one of those times when the indicators never signal a downturn. But, more to the point, he says, “we have always contended that the binary issue, ‘is there going to be a recession? overlooks the point; any recession should be fairly modest and brief, in our opinion.”
The economy's fundamentals of Baird’s McAllister says is why a downturn shouldn't be all that severe. “You’ve got households in quite good shape,” he says. “People aren’t over-levered and even if home values come down, there is a lot of equity there.” What’s more, with interest rates low, corporate balance sheets remain healthy and “on the state and local level, finances generally ‘have never looked better, with strong tax revenues and reserves at record highs,’” he says.
At Goldman Sachs, Wilson-Elizondo says the jury is still out on the kind of landing the economy will get as a consequence of the Fed’s aggressive hiking of interest rates. “There are some real wild cards that have not been settled,” she says.
One of them is the fallout from the Fed’s winding down of its mammoth bond purchases, which it carried out during the Covid-19 recession to inject money into the financial system and the economy. (This Fed initiative is more commonly called quantitative tightening.)
The second is the speed at which China is reopening its economy from its draconian “zero-Covid-19” policies, something which could go in fits and starts and both lift the global economy and lead to more commodity inflation alongside.
In the US economy, Wilson-Elizondo says they’re watching three variables in the labor market to start forming an opinion of whether things are going toward a hard landing or a soft landing: the ratio of job vacancies to job seekers, the proportion of the workforce that’s participating in the labor market and the pace of job growth.
By how much will inflation fall?
As for the outlook for inflation, the question in the markets the past few weeks has been the direction in which inflation rates have been moving: down. But what really counts, Wilson-Elizondo says, is where actual inflation lands. The most recent reading of the CPI, in October, put the 12-month rate at 7.7 percent.
“We are very focused on the outright level more than the path,” she says.
“But in terms of the path, how fast (inflation comes down) is very important.” For now, she says, what is clear is “it is hard to see getting back to the 2 percent target rate anytime soon,” and, “we think they are going to have to stay restrictive.”
At NatWest, Nevruzi says himself and his colleagues are certainly on the hunt for a recession that starts before the end of this year driven down by consumer spending “but not anything like a collapse where you start seeing activity come to a halt.” Instead, he says, “We’re seeing the economy tipping into a recession, more of a slow slide, and slowly edging back up into 2024.”
With this as the background, NatWest has a slow drop in inflation in 2023, though the CPI would still be residing above a 4% annual rate in the middle of 2023 and fall only just below 3% by the end of the year. Some of the slower-moving parts, including rental costs or the cost of services including airfares, will likely help to keep inflation on a “modest path,” he said”. The reason: “That’s why we think the Fed will hike to 5% (versus its current target of 3.75%-4%) and will remain at 5% through the end of the year,” he adds.